Lab 4: Using the Spectrophotometer to Measure the Rate of Bacterial Cell Division: A Bacterial Population Growth Curve
Lab 4: Using the Spectrophotometer to Measure the Rate of Bacterial Cell Division: A Bacterial Population Growth Curve
Introduction
The purpose of this lab will ultimately be to observe the growth of an Escherichia coli population in its lag phase, its exponential growth phase and its stationary phase. Each group will measure the turbidity of different E. coli samples all taken at different times to get a wide range of measurements that will then construct a growth graph. The biggest issue will most likely be the counting of the hemocytometerns that contain the E. coli.
While it is different for every bacteria, E. coli has a doubling time as short as 20 minutes. However, once they are placed in a growth medium (in this case LB broth), they will take some getting used to their environment. This period of adjustment is called the lag phase and will seen as the initial flatline on the growth curve graph. Once the cells microorganisms are comfortable, they will enter an exponential growth phase where they will divide rapidly. This will continue until all the nutrients are used up and until there is no more room to divide. Once this stationary phase happens, the graph will again level off but at a much higher vertical point than the initial lag phase.
The growth curve we will be conducting will only measure these three phases, omitting the death phase. The measurements we will be taking will be based on the turbidity of the sample, which is directly proportional to the number of cells in the sample. A spectrophotometer works by sending a beam of light into the liquid sample and measuring the amount of light transmitted or adsorbed by the solution. A high adsorption value indicates that not a lot of light is being transmitted through the solution (more murky than clear) and a lot of cells are present. A low adsorption value indicates that a lot of light is being transmitted through the solution (more clear than murky) and not a lot of cells are present. This turbidity value is directly related to the cell numbers in the culture. However, it is important to realize that the death phase will be omitted from the turbidity readings because as the cells do die in the solution, they still remain in the tube. The spectrophotometer does not measure how many are alive, just how many are in the solution.
The other part to this lab will be placing each of the solutions, each inoculated 1 hour apart, under the microscope and counting the number of cells observed using a hemocytometer (a glass plate with a microscopic grid etched into it). The hemocytometer count (number of cells) will be measured, the number of squares counted will be noted along with the dilution factor and these numbers will be placed in to a formula to calculate the total cells per mL of solution. This will then be placed on a Concentration v. Time graph and the growth curve will be observed.
Methods and Materials
PRIOR TO LAB PERIOD 1 mL of E. coli was placed into 100 mL of Luria Broth in a sterile Erlenmeyer flask and allowed to incubate at 37*C. Later, 10 mL samples were removed each 1 hour apart placed on ice to halt bacterial growth.
ANALYZING BACTERIAL SAMPLES The wavelength was set to 600 nm on the spectrophotometer. A tube of pure Luria Broth was placed in the machine as a 'blank' as the broth does have a slight tint to it. It read 0 absorbance. Each of the student samples were then placed in the spectrophotometer and the absorbance was recorded. (For example, our two samples were both @ 4:20 pm, 0.255 A, 0.358 A). Then, a small bit of our solution was placed on the hemocytometer and using the $20,000+ microscope, the number of bacteria were counted in 5 different squares. (Actually the counting was done by Dr. T as time did was of the essence!) These measurements were then pooled by the class and the necessary calculations and graphing was completed.
Results
Table 1. Measured quantities and calculated total cell count
Total Cells/mL=(total cells counted)*(Dilution factor/# of squares)*(10,000 cells/mL)


References
Miamioh. E. coli [Digital image]. Accessed online 3 October 2017 at <http://www.cas.miamioh.edu/mbi-ws/bacteriaproject/images/ecoli.gif>.
Thomson, Ashley. "Lab #3: Using the Spectrophotometer to Measure the Rate of Bacterial Cell Division: A Bacterial Population Growth Curve."
 |
| (Photo:Miamioh) |
The purpose of this lab will ultimately be to observe the growth of an Escherichia coli population in its lag phase, its exponential growth phase and its stationary phase. Each group will measure the turbidity of different E. coli samples all taken at different times to get a wide range of measurements that will then construct a growth graph. The biggest issue will most likely be the counting of the hemocytometerns that contain the E. coli.
While it is different for every bacteria, E. coli has a doubling time as short as 20 minutes. However, once they are placed in a growth medium (in this case LB broth), they will take some getting used to their environment. This period of adjustment is called the lag phase and will seen as the initial flatline on the growth curve graph. Once the cells microorganisms are comfortable, they will enter an exponential growth phase where they will divide rapidly. This will continue until all the nutrients are used up and until there is no more room to divide. Once this stationary phase happens, the graph will again level off but at a much higher vertical point than the initial lag phase.
The growth curve we will be conducting will only measure these three phases, omitting the death phase. The measurements we will be taking will be based on the turbidity of the sample, which is directly proportional to the number of cells in the sample. A spectrophotometer works by sending a beam of light into the liquid sample and measuring the amount of light transmitted or adsorbed by the solution. A high adsorption value indicates that not a lot of light is being transmitted through the solution (more murky than clear) and a lot of cells are present. A low adsorption value indicates that a lot of light is being transmitted through the solution (more clear than murky) and not a lot of cells are present. This turbidity value is directly related to the cell numbers in the culture. However, it is important to realize that the death phase will be omitted from the turbidity readings because as the cells do die in the solution, they still remain in the tube. The spectrophotometer does not measure how many are alive, just how many are in the solution.
The other part to this lab will be placing each of the solutions, each inoculated 1 hour apart, under the microscope and counting the number of cells observed using a hemocytometer (a glass plate with a microscopic grid etched into it). The hemocytometer count (number of cells) will be measured, the number of squares counted will be noted along with the dilution factor and these numbers will be placed in to a formula to calculate the total cells per mL of solution. This will then be placed on a Concentration v. Time graph and the growth curve will be observed.
 |
| (Photo: Lauren Lukasik) |
PRIOR TO LAB PERIOD 1 mL of E. coli was placed into 100 mL of Luria Broth in a sterile Erlenmeyer flask and allowed to incubate at 37*C. Later, 10 mL samples were removed each 1 hour apart placed on ice to halt bacterial growth.
ANALYZING BACTERIAL SAMPLES The wavelength was set to 600 nm on the spectrophotometer. A tube of pure Luria Broth was placed in the machine as a 'blank' as the broth does have a slight tint to it. It read 0 absorbance. Each of the student samples were then placed in the spectrophotometer and the absorbance was recorded. (For example, our two samples were both @ 4:20 pm, 0.255 A, 0.358 A). Then, a small bit of our solution was placed on the hemocytometer and using the $20,000+ microscope, the number of bacteria were counted in 5 different squares. (Actually the counting was done by Dr. T as time did was of the essence!) These measurements were then pooled by the class and the necessary calculations and graphing was completed.
 |
| (Photo: Amy He) |
Table 1. Measured quantities and calculated total cell count
Total Cells/mL=(total cells counted)*(Dilution factor/# of squares)*(10,000 cells/mL)

Graph 1. Calculated total cell count vs. time

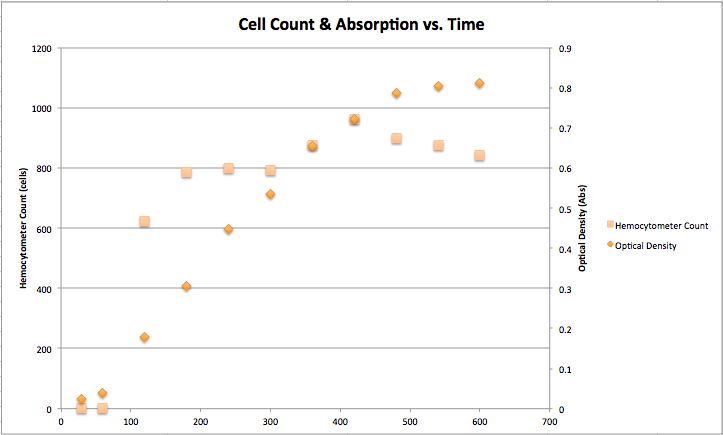
Graph 2. Hemocytometer counts and spectrophotometer readings with a secondary axis
Analysis Questions
CONCISELY EXPLAIN WHY THE ABSORBANCE (A) VALUES INCREASED AS THE EXPERIMENT PROCEEDED.
As the absorbance increased, the light emitted from the spectrophotometer was more apt to be absorbed than transmitted by the solution because the solution became cloudier and cloudier as more cells were likewise in the solution. (Higher absorbance = more growth in solution)
SEE GRAPH FOR LABELING. ESTIMATE THE FOLLOWING:
HOW LONG DID THE LAG PHASE LAST? Approximately 80 minutes.
HOW LONG DID THE LOG PHASE LAST? Approximately 270 minutes.
CALCULATE THE FOLLOWING:
RATE OF BACTERIAL GROWTH DURING LAG PHASE: (ΔBacteria/ΔTime) = (1 cell - 1 cell)/(80 min) = 0 cells/min
RATE OF BACTERIAL GROWTH DURING LOG PHASE:(ΔBacteria/ΔTime) = (25,000,000 cells - 2,500,000 cells)/(270 min) = 83,333 cells/min
IF AN ANTIBIOTIC IS ADDED TO THE INOCULATED MEDIUM AT TIME 0 MIN, HYPOTHESIZE HOW THIS WOULD AFFECT ABS READINGS? EXPLAIN IN WORDS AND DRAW A SKETCH OF WHAT THE GRAPH WOULD LOOK LIKE.
I believe that the absorbance readings would increase a little bit to account for the addition of the antibiotic into the solution, and then it would remain close to 0 as there would be only the dead E. coli that were originally in the solution to start. The graph (the red line) would basically be a flat line.

IF AN ANTIBIOTIC IS ADDED TO THE INOCULATED MEDIUM AT TIME 180 MIN, HYPOTHESIZE HOW THIS WOULD AFFECT ABS READINGS? EXPLAIN IN WORDS AND DRAW A SKETCH OF WHAT THE GRAPH WOULD LOOK LIKE.
I believe that the absorbance readings would increase normally until 180 minutes of log growth and increase a little farther because the solution would then be inundated with both antibiotics and dead E. coli. The graph (the red line) would then level off a little bit past 180 minutes because it would no longer change.

Discussion
Graph 1 shows that as time increases, the concentration of cells likewise increase. It is important to note that there is a clear lag phase where the cells are getting comfortable with their environment (labeled) and then one they realize there is plenty of room and nutrients in the Luria broth, they launch into an explosive log phase. Here is where the 'doubling time of 20 minutes' comes into play because the rate of growing is fantastic. When the cell count levels off at the stationary phase, the bacteria no longer have adequate space nor food and therefore have reached their maximum capacity. Since they are also not canibals, they will begin to die shortly after this stationary phase. However, the adsorption readings nor our hemocytometer measurements can reflect that because the spectrophotometer will still measure the light through a solution with dead E. coli and we will still count dead E. coli because neither the machine nor we can differentiate the two.
The graph I created of the double y-axis shows the adsorption readings and the hemocytometer counts both plotted against time. It reflects the idea that as the adsorption increases, so does the hemocytometer counts. If there was not a strange blip in the data for the hemocytometer counts it would be more obvious. Nonetheless, the principle stands.
As hypothesized, the most difficult part were the hemocytometer counts. While it was originally intended for us to count them, Dr. T ended up doing the counting and sending us the data for the sake of time and simplicity. If this lab were to be repeated, more time should be allotted for each group to do their own counting.
 |
| (Photo: Lauren Lukasik) |
Miamioh. E. coli [Digital image]. Accessed online 3 October 2017 at <http://www.cas.miamioh.edu/mbi-ws/bacteriaproject/images/ecoli.gif>.
Thomson, Ashley. "Lab #3: Using the Spectrophotometer to Measure the Rate of Bacterial Cell Division: A Bacterial Population Growth Curve."


Comments
Post a Comment